Every Balanced Advantage Fund Rose in a Month: The Category Gained 3.70% on Average


Key Highlights
Balanced Advantage funds: average 1-month 3.70%, 1-year 2.41%, 3-year 10.79% a year across 22 Direct Growth plans, to 5 November 2026.
Returns as of: 5 November 2026
- Category average return: 1 month 3.70%, 1 year 2.41%, 3 years 10.79% a year
- Every fund rose over the past month
- Most funds had a positive return over one year
- 2% of 1-year rolling windows ended below zero
- Average expense ratio of Direct plans: 1.03%
- Largest fund by assets: HDFC Balanced Advantage Fund
Balanced Advantage funds performance: the category average rose 3.70% over the month. Every fund rose over the month. The 1-year average was 2.41% and most funds had a positive return over one year.
Balanced Advantage funds: returns across the category
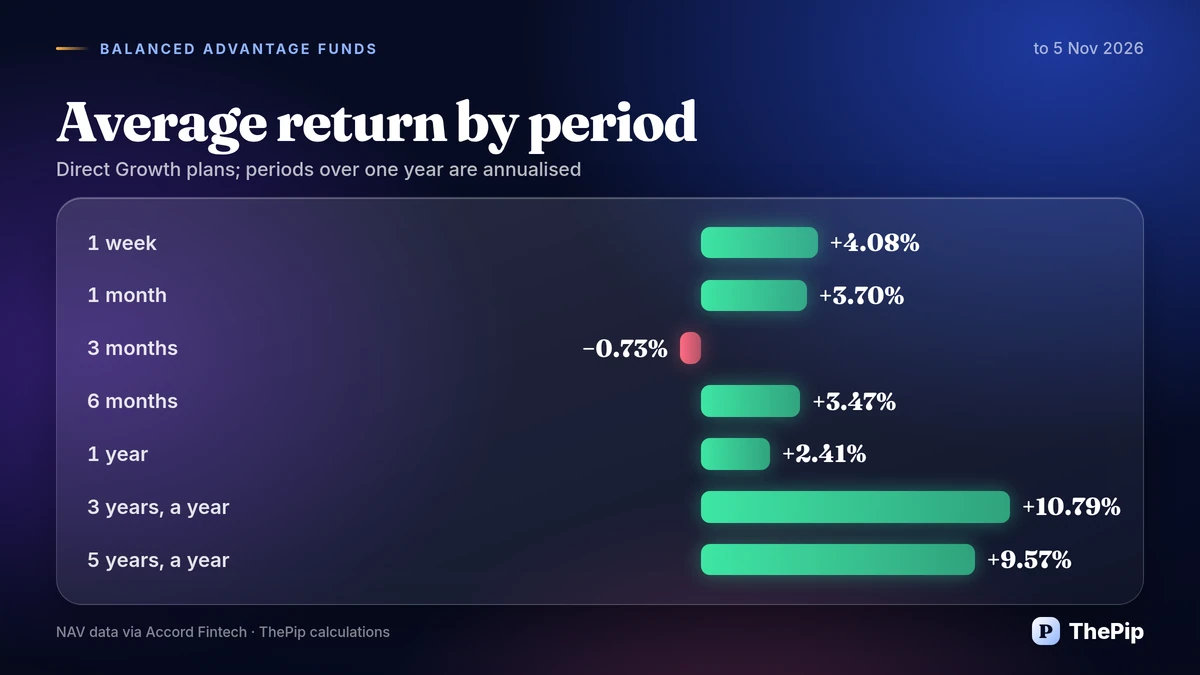
| Period | Average | Median | Funds with a positive return | Funds counted |
|---|---|---|---|---|
| 1 week | 4.08% | 4.04% | 22 of 22 | 22 |
| 1 month | 3.70% | 3.62% | 22 of 22 | 22 |
| 3 months | −0.73% | −0.45% | 5 of 21 | 21 |
| 6 months | 3.47% | 3.99% | 20 of 21 | 21 |
| 1 year | 2.41% | 2.71% | 17 of 20 | 20 |
| 3 years (a year) | 10.79% | 10.57% | 18 of 18 | 18 |
| 5 years (a year) | 9.57% | 9.76% | 15 of 15 | 15 |
The 1-year average of 2.41% is lower than the 3-year average of 10.79%. All funds delivered a positive return over the 3-year period. The category median return was 2.71% for the 1-year period.
Highest and lowest returns over the past month
| Fund | 1 month | 1 week |
|---|---|---|
| Bajaj Finserv Balanced Advantage Fund | 5.67% | 6.13% |
| JioBlackRock Balanced Advantage Fund | 4.97% | 3.83% |
| ICICI Pru Balanced Advantage Fund | 4.96% | 4.39% |
| Fund | 1 month | 1 week |
|---|---|---|
| ITI Balanced Advantage Fund | 0.69% | 3.58% |
| The Wealth Company Balanced Advantage Fund | 2.24% | 3.87% |
| HSBC Balanced Advantage Fund | 2.44% | 3.50% |
Highest 3-year returns
| Fund | 1 year | 3 years (a year) | Expense ratio |
|---|---|---|---|
| Aditya Birla SL Balanced Advantage Fund | 6.86% | 12.92% | 0.89% |
| Baroda BNP Paribas Balanced Advantage Fund | 3.99% | 12.88% | 0.92% |
| Axis Balanced Advantage Fund | 2.83% | 12.78% | 1.00% |
| WOC Balanced Advantage Fund | 3.39% | 12.47% | 0.84% |
| Mahindra Manulife Balanced Advantage Fund | 3.52% | 12.14% | 0.83% |
Rolling returns
| Measure | Category average 1-year return |
|---|---|
| Lowest window | −3.2% (ending 23 October 2026) |
| Median | 8.9% |
| Highest window | 28.5% (ending 28 March 2024) |
| Share of windows below zero | 2% |
| Latest window (ending 5 November 2026) | 2.4% |
The lowest 1-year rolling return was −3.2% and the highest was 28.5%. The median rolling return was 8.9%. The latest rolling window of 2.4% is lower than the median rolling window.
Largest funds and costs
| Fund | Assets (₹ crore) | 1 year | 3 years (a year) |
|---|---|---|---|
| HDFC Balanced Advantage Fund | 1,02,534 | −0.40% | 11.85% |
| ICICI Pru Balanced Advantage Fund | 71,913 | 5.08% | 11.91% |
| SBI Balanced Advantage Fund | 40,545 | 0.38% | 10.36% |
| Kotak Balanced Advantage Fund | 16,618 | 2.79% | 10.48% |
| Aditya Birla SL Balanced Advantage Fund | 9,836 | 6.86% | 12.92% |
| Expense ratio | Funds counted | |
|---|---|---|
| Average | 1.03% | 22 |
| Lowest: JioBlackRock Balanced Advantage Fund | 0.56% | |
| Highest: ITI Balanced Advantage Fund | 1.57% |
Balanced Advantage funds: FAQs
How have Balanced Advantage funds performed over the past year?
The average 1-year return of 20 Direct Growth Balanced Advantage funds was 2.41% to 5 November 2026; most funds had a positive return. The average 3-year return was 10.79% a year across 18 funds.
What is the average expense ratio of Balanced Advantage funds?
The average expense ratio of 22 Direct plans in the Balanced Advantage category is 1.03%. It ranges from 0.56% (JioBlackRock Balanced Advantage Fund) to 1.57% (ITI Balanced Advantage Fund).
Which Balanced Advantage fund is the largest?
HDFC Balanced Advantage Fund has the largest assets among Balanced Advantage funds, ₹1,02,534 crore at 30 September 2026, across all its plans.
What are rolling returns?
Rolling returns measure the return over every window of a fixed length, not just the one ending today. Here, each 1-year window ending between 6 November 2023 and 5 November 2026 is averaged across 17 funds, so the result does not depend on one start date.
Why are Direct plans compared?
Direct plans have no distributor commission in their cost, so they are the cleanest way to compare the funds themselves. Regular plans of the same funds charge a higher expense ratio, which reduces their returns.
, expense and portfolio data: Accord Fintech. Calculations: ThePip. For information only; not investment advice.