·
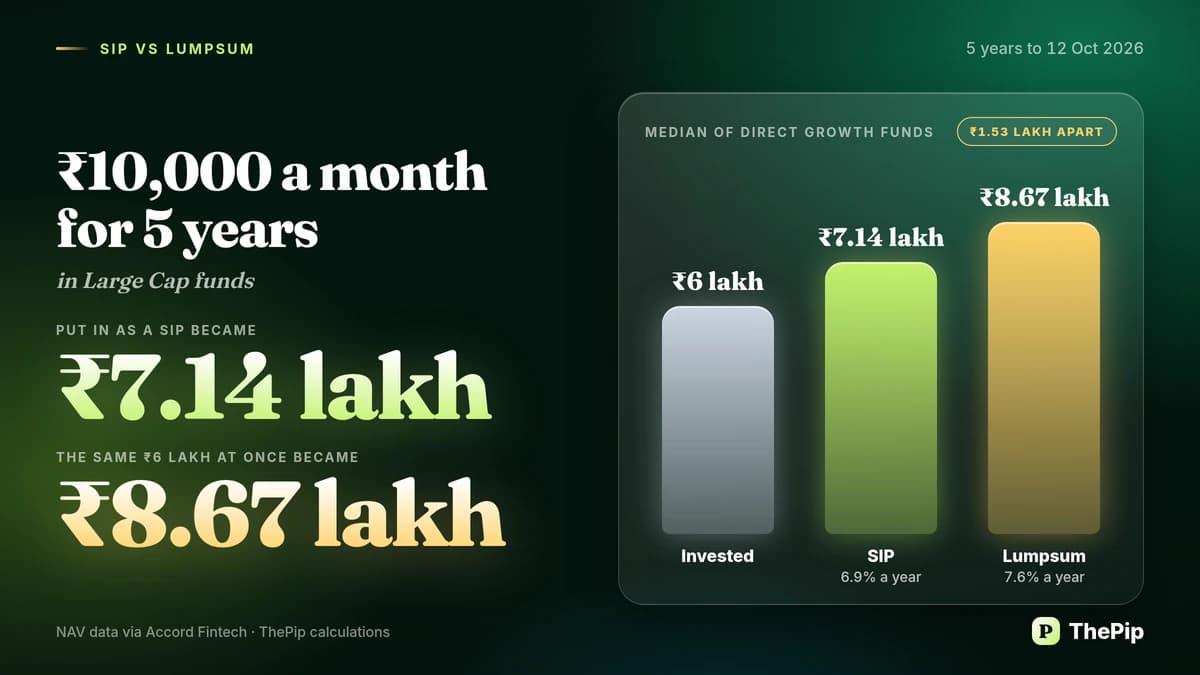
By ThePip Desk₹10,000 a month for 5 years in Large Cap funds became ₹7,13,972 (median), 6.91% a year. A lumpsum of ₹6,00,000: ₹8,66,813.
NAVs as of: 12 October 2026
-
3 years: ₹10,000 a month (₹3,60,000 in all) became ₹3,62,412 at the median, 0.44% a year
-
3 years: ₹3,60,000 invested at once became ₹4,59,608 at the median, 8.47% a year
-
3 years: every fund ended with more as a lumpsum than as a SIP
-
5 years: ₹10,000 a month (₹6,00,000 in all) became ₹7,13,972 at the median, 6.91% a year
-
5 years: ₹6,00,000 invested at once became ₹8,66,813 at the median, 7.63% a year
-
5 years: every fund ended with more as a lumpsum than as a SIP
SIP vs lumpsum in Large Cap funds shows a median SIP value of ₹3,62,412 for a ₹3,60,000 investment over three years. Over five years, the median SIP value reached ₹7,13,972 for a total investment of ₹6,00,000. The median lumpsum value for the three-year period stood at ₹4,59,608. For the five-year period, the median lumpsum value was ₹8,66,813.
How the comparison was made
Both ways of investing use the same funds: the Direct Growth plans of Large Cap funds that have the whole period’s NAV history. The SIP puts in ₹10,000 on the first trading day of each month. The lumpsum puts in the same total, ₹6,00,000 for the 5-year window, on the first day. Both are valued at the NAV on 12 October 2026. The figures are the median across funds; the table also gives the lowest and highest fund. They describe what happened in these periods and say nothing about the next one.
SIP vs lumpsum in Large Cap funds: the results
|
Large Cap funds, Direct Growth plans: median result across funds, 12 October 2023 to 12 October 2026 for the longest window — Source: NAV data via Accord Fintech, ThePip calculations |
||||
|
Way of investing |
Invested |
Median value |
Median annualised return |
Lowest to highest fund |
|---|---|---|---|---|
|
3 years: SIP (36 × ₹10,000) |
₹3,60,000 |
₹3,62,412 |
0.44% |
−1.17% to 6.64% |
|
3 years: lumpsum (₹3,60,000 on day one) |
₹3,60,000 |
₹4,59,608 |
8.47% |
5.77% to 12.35% |
|
5 years: SIP (60 × ₹10,000) |
₹6,00,000 |
₹7,13,972 |
6.91% |
4.40% to 10.51% |
|
5 years: lumpsum (₹6,00,000 on day one) |
₹6,00,000 |
₹8,66,813 |
7.63% |
4.35% to 11.16% |
The median SIP value is lower than the median lumpsum value. Every fund ended with more as a lumpsum than as a SIP. Over three years, the median lumpsum value of ₹4,59,608 is higher than the median SIP value of ₹3,62,412. The five-year median lumpsum value of ₹8,66,813 is higher than the median SIP value of ₹7,13,972.
|
In how many funds did each way of investing end with more? — Source: NAV data via Accord Fintech, ThePip calculations |
|||
|
Window |
Funds with the full history |
Lumpsum ended with more |
SIP ended with more |
|---|---|---|---|
|
3 years to 12 October 2026 |
30 |
30 |
0 |
|
5 years to 12 October 2026 |
28 |
28 |
0 |
FAQs
What is the difference between a SIP and a lumpsum?
A SIP invests a fixed amount at regular intervals, here on the first trading day of every month. A lumpsum invests the whole amount at once, here on the first day of the period.
How much did a ₹10,000 monthly SIP in Large Cap funds become over 5 years?
Across 28 Direct Growth plans with the full history, ₹6,00,000 invested over 60 months became ₹7,13,972 at the median, a return of 6.91% a year. The funds ranged from ₹6,70,500 to ₹7,81,079.
Did a SIP or a lumpsum end with more in Large Cap funds?
Over the 5 years to 12 October 2026, the median value of the SIP was lower than the median value of the lumpsum, and every fund ended with more as a lumpsum than as a SIP. The result belongs to this period; another period can differ.
Why is the SIP return not compared directly with the lumpsum return?
SIP money goes in over time, so each instalment is invested for a different length of time. The SIP return is the annualised rate that matches those dated cash flows; the lumpsum return is the annual rate over the whole period.
NAV data: Accord Fintech. Calculations: ThePip. For information only; not investment advice.