Tata Money Market Fund: ₹10,000 Put In Three Years Ago Is ₹12,402 Now; Up 6.45% in a Year


Key Highlights
₹10,000 in Tata Money Market Fund three years ago is ₹12,402 now (27 Oct 2026). 1-year 6.45%, 3-year 7.43% a year.
Returns as of: 27 October 2026
- ₹10,000 put in three years ago is worth ₹12,402 now
- 1-year return: 6.45%, higher than the category average of 6.36%
- 3-year return: 7.43% a year, higher than the category average of 7.23%
- Expense ratio (Direct plan): 0.18%, higher than the category average of 0.17%
- Assets: ₹31,690 crore at 30 September 2026
- Largest holding: ** – SMALL INDUST DEVLOP BANK OF INDIA – CD – 03/09/2027, 5.75% of the fund; the top ten are 34.30%
- Volatility over three years: 0.43% a year
The Tata Money Market Fund returned 6.45% over the past year, while an investment of ₹10,000 made three years ago is worth ₹12,402. The fund maintains an expense ratio of 0.18%. Total assets were ₹31,690 crore at 30 September 2026.
Tata Money Market Fund: key details
| Fund house | Tata Mutual Fund |
| Category | Debt – Money Market Fund |
| CRISIL Money Market Index | |
| Expense ratio (Direct plan) | 0.18% |
| Assets | ₹31,690 crore (30 September 2026) |
| Minimum investment | ₹5,000 |
| ₹150 | |
| Exit load | Nil |
| Fund managers | Amit Somani, Harsh Dave |
Tata Money Market Fund: returns
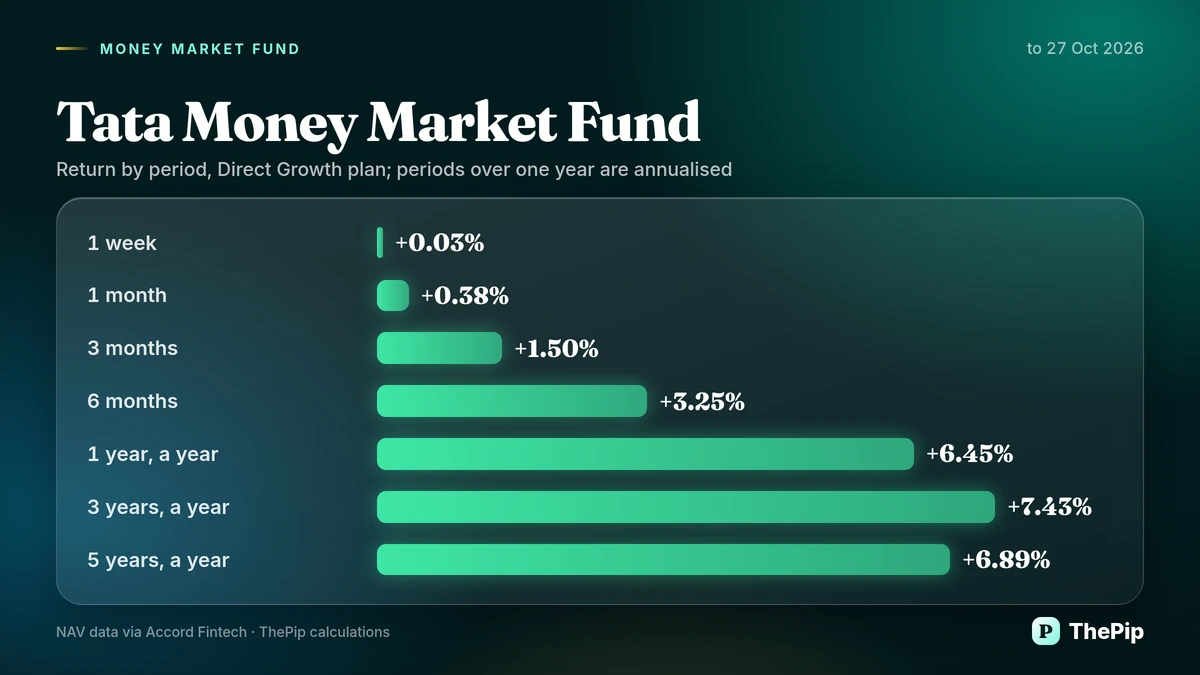
| Period | Fund return | Category average | Rank in category |
|---|---|---|---|
| 1 week | 0.03% | – | – |
| 1 month | 0.38% | – | – |
| 3 months | 1.50% | – | – |
| 6 months | 3.25% | – | – |
| 1 year (a year) | 6.45% | 6.36% (25 funds) | 4 of 25 |
| 3 years (a year) | 7.43% | 7.23% (23 funds) | 1 of 23 |
| 5 years (a year) | 6.89% | – | – |
The 1-year return of 6.45% is higher than the category average of 6.36%. Over three years, the fund returned 7.43% a year, which is higher than the category average of 7.23%. The expense ratio of 0.18% is higher than the category average of 0.17%.
Assets over recent months
| Month | Assets (₹ crore) |
|---|---|
| 30 April 2026 | 37,476 |
| 31 May 2026 | 33,030 |
| 30 June 2026 | 32,150 |
| 31 July 2026 | 34,138 |
| 31 August 2026 | 34,511 |
| 30 September 2026 | 31,690 |
Volatility and largest fall
| Measure | Fund | Category median |
|---|---|---|
| Volatility (annualised) | 0.43% | 0.43% |
| Largest fall from a high (11 May 2026 to 22 May 2026) | −0.15% | −0.15% |
The fund experienced a volatility of 0.43% a year, which is the same as the category median of 0.43%. The largest fall of the NAV from a high was −0.15%, matching the category median of −0.15%.
Portfolio: top holdings
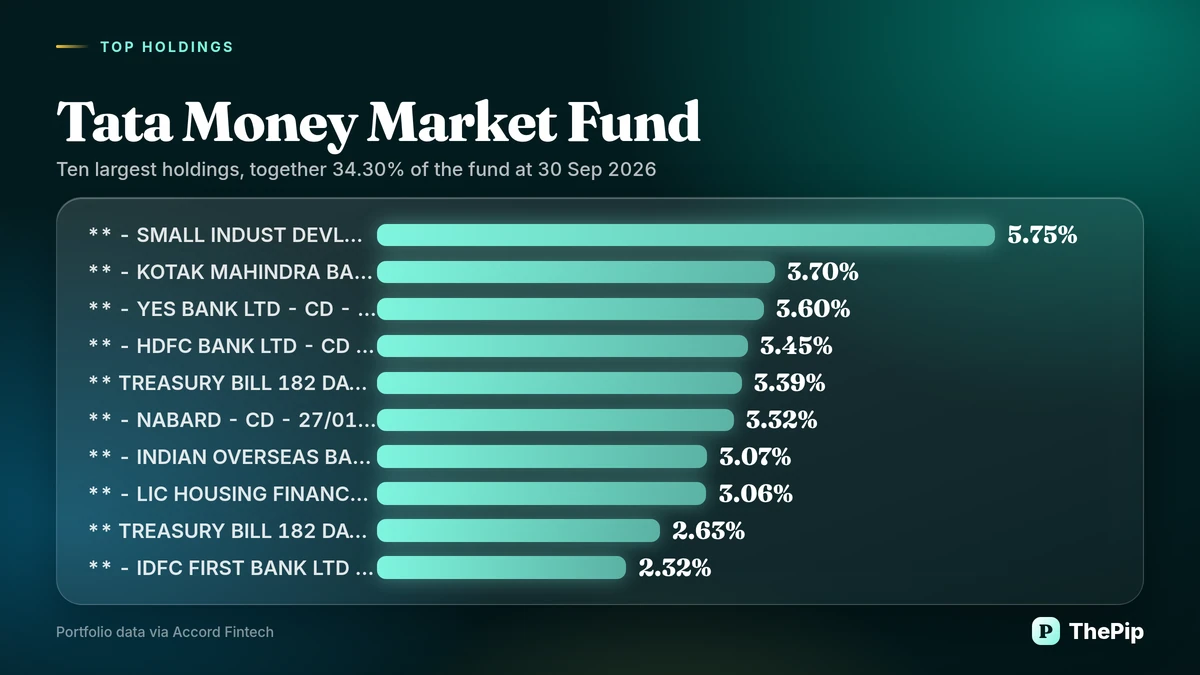
| Holding | Sector | Value (₹ crore) | |
|---|---|---|---|
| ** – SMALL INDUST DEVLOP BANK OF INDIA – CD – 03/09/2027 | – | 5.75% | 1,822 |
| ** – KOTAK MAHINDRA BANK – CD – 04/02/2027 | – | 3.70% | 1,173 |
| ** – YES BANK LTD – CD – 05/03/2027 | – | 3.60% | 1,140 |
| ** – HDFC BANK LTD – CD – 05/03/2027 | – | 3.45% | 1,093 |
| ** TREASURY BILL 182 DAYS (26/02/2027) | – | 3.39% | 1,075 |
| ** – NABARD – CD – 27/01/2027 | – | 3.32% | 1,052 |
| ** – INDIAN OVERSEAS BANK – CD – 24/02/2027 | – | 3.07% | 973 |
| ** – LIC HOUSING FINANCE LTD – CP – 05/03/2027 | – | 3.06% | 971 |
| ** TREASURY BILL 182 DAYS (28/01/2027) $$ | – | 2.63% | 834 |
| ** – IDFC FIRST BANK LTD – CD – 15/01/2027 | – | 2.32% | 735 |
| Type | Weight |
|---|---|
| Certificate of Deposit | 57.12% |
| Commercial Paper | 29.56% |
| Treasury Bills | 11.83% |
| Government Securities | 2.22% |
| Alternative Investment Fund | 0.32% |
| Cash & Cash Equivalents and Net Assets | -1.06% |
The portfolio held 86 securities at 30 September 2026, with the ten largest accounting for 34.30% of the fund. The largest holding is SMALL INDUST DEVLOP BANK OF INDIA – CD – 03/09/2027 at 5.75%. Certificate of Deposit holdings make up 57.12% of the portfolio.
Objective
The scheme states its objective as follows.
The investment objective is to generate returns with reasonable liquidity to the unitholders by investing in money market instruments.
Fund managers
| Name | Role | Experience |
|---|---|---|
| Amit Somani | 12 Years | |
| Harsh Dave | Junior Fund Manager | 2 Years |
Tata Money Market Fund: FAQs
What would ₹10,000 in the Tata Money Market Fund be worth today?
₹10,000 put into the Direct Growth plan on 27 October 2023 would have been worth ₹12,402 on 27 October 2026. This is what happened over those three years, not a forecast.
What is the return of the Tata Money Market Fund?
The Direct Growth plan returned 6.45% over one year to 27 October 2026, higher than the category average of 6.36%. Over three years it returned 7.43% a year.
What is the expense ratio of the Tata Money Market Fund?
The expense ratio of the Direct plan is 0.18%; the average for 27 Direct plans in the category is 0.17%.
How large is the Tata Money Market Fund?
Its assets were ₹31,690 crore at 30 September 2026.
What are the top holdings of the Tata Money Market Fund?
At 30 September 2026 the largest holdings were ** – SMALL INDUST DEVLOP BANK OF INDIA – CD – 03/09/2027 (5.75%), ** – KOTAK MAHINDRA BANK – CD – 04/02/2027 (3.70%), ** – YES BANK LTD – CD – 05/03/2027 (3.60%). The top ten made up 34.30% of the fund.
Who manages the Tata Money Market Fund?
The fund is managed by Amit Somani, Harsh Dave.
What is the minimum investment in the Tata Money Market Fund?
The minimum investment is ₹5,000. The minimum is ₹150.
What is the exit load of the Tata Money Market Fund?
The scheme states its exit load as: Nil
What is the benchmark of the Tata Money Market Fund?
The scheme’s benchmark is the CRISIL Money Market Index.
NAV, expense and portfolio data: Accord Fintech. Calculations: ThePip. For information only; not investment advice.