SBI Gilt Fund: ₹10,000 Put In Three Years Ago Is ₹12,123 Now; Up 3.93% in a Year


Key Highlights
₹10,000 in SBI Gilt Fund three years ago is ₹12,123 now (3 Nov 2026). 1-year 3.93%, 3-year 6.62% a year.
Returns as of: 3 November 2026
- ₹10,000 put in three years ago is worth ₹12,123 now
- 1-year return: 3.93%, higher than the category average of 2.80%
- 3-year return: 6.62% a year, higher than the category average of 6.13%
- Expense ratio (Direct plan): 0.50%, the same as the category average of 0.50%
- Assets: ₹8,067 crore at 30 September 2026
- Largest holding: 6.94% CGL 2036, 44.20% of the fund; the top ten are 87.43%
- Volatility over three years: 2.68% a year
The SBI Gilt Fund turned an investment of ₹10,000 into ₹12,123 over the last three years. Its 1-year return of 3.93% is higher than the 2.80% category average for the Debt – Gilt Fund category. The fund carries an expense ratio of 0.50%. Total assets were ₹8,067 crore at 30 September 2026.
SBI Gilt Fund: key details
| Fund house | SBI Mutual Fund |
| Category | Debt – Gilt Fund |
| Nifty All Duration G-Sec Index | |
| Expense ratio (Direct plan) | 0.50% |
| Assets | ₹8,067 crore (30 September 2026) |
| Minimum investment | ₹5,000 |
| ₹500 | |
| Exit load | Nil |
| Fund managers | Sudhir Agarwal |
SBI Gilt Fund: returns
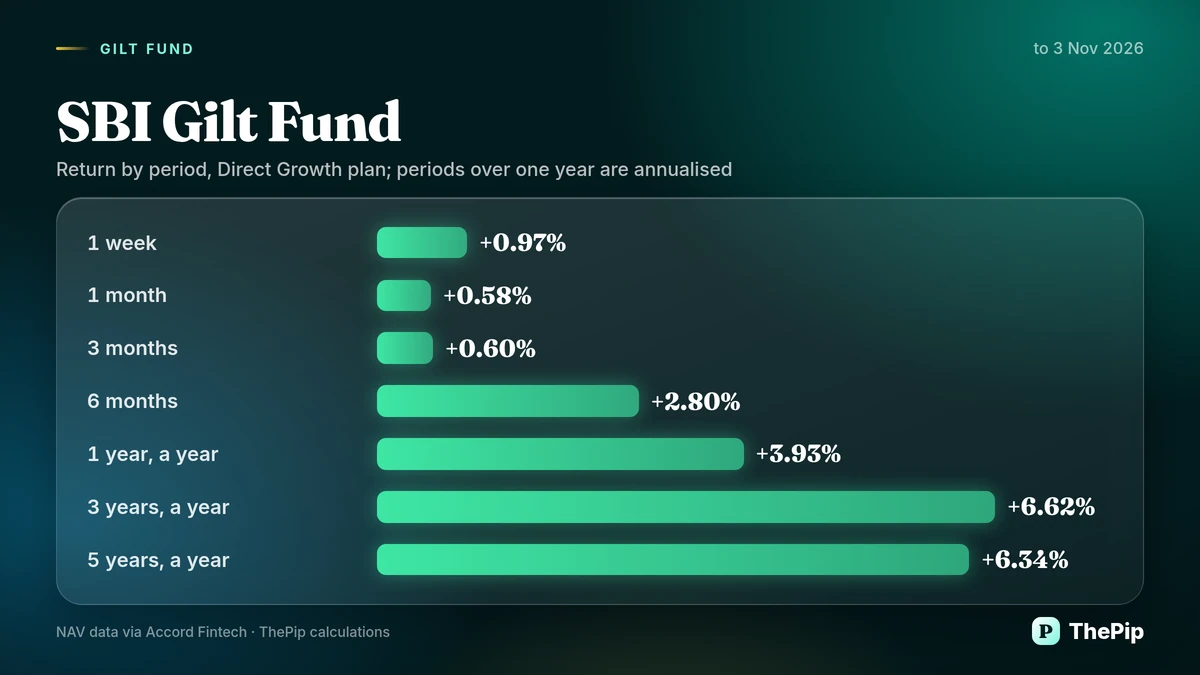
| Period | Fund return | Category average | Rank in category |
|---|---|---|---|
| 1 week | 0.97% | – | – |
| 1 month | 0.58% | – | – |
| 3 months | 0.60% | – | – |
| 6 months | 2.80% | – | – |
| 1 year (a year) | 3.93% | 2.80% (26 funds) | 4 of 26 |
| 3 years (a year) | 6.62% | 6.13% (24 funds) | 3 of 24 |
| 5 years (a year) | 6.34% | – | – |
The 1-year return of 3.93% is higher than the category average of 2.80%. Over three years, the fund returned 6.62% a year, which is higher than the category average of 6.13%. The fund is number 4 by return among 26 funds.
Assets over recent months
| Month | Assets (₹ crore) |
|---|---|
| 30 April 2026 | 9,047 |
| 31 May 2026 | 8,695 |
| 30 June 2026 | 8,455 |
| 31 July 2026 | 8,306 |
| 31 August 2026 | 8,215 |
| 30 September 2026 | 8,067 |
Volatility and largest fall
| Measure | Fund | Category median |
|---|---|---|
| Volatility (annualised) | 2.68% | 3.09% |
| Largest fall from a high (28 May 2025 to 26 August 2025) | −3.23% | −3.67% |
The fund recorded a volatility of 2.68% a year, which is lower than the category median of 3.09%. Its largest fall from a high was −3.23%. This decline is smaller than the category median of −3.67%.
Portfolio: top holdings
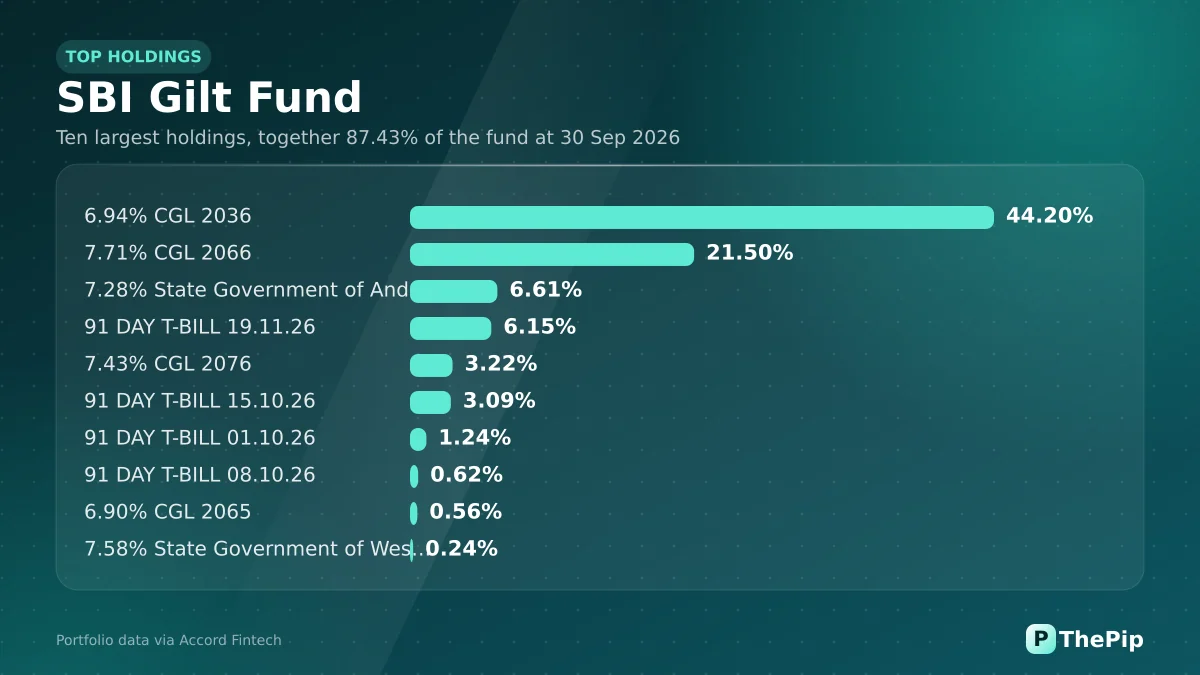
| Holding | Sector | Value (₹ crore) | |
|---|---|---|---|
| 6.94% CGL 2036 | – | 44.20% | 3,566 |
| 7.71% CGL 2066 | – | 21.50% | 1,735 |
| 7.28% State Government of Andhra Pradesh 2032 | – | 6.61% | 533 |
| 91 DAY T-BILL 19.11.26 | – | 6.15% | 496 |
| 7.43% CGL 2076 | – | 3.22% | 260 |
| 91 DAY T-BILL 15.10.26 | – | 3.09% | 250 |
| 91 DAY T-BILL 01.10.26 | – | 1.24% | 100 |
| 91 DAY T-BILL 08.10.26 | – | 0.62% | 50 |
| 6.90% CGL 2065 | – | 0.56% | 45 |
| 7.58% State Government of West Bengal 2042 | – | 0.24% | 19 |
| Type | Weight |
|---|---|
| Government Securities | 76.45% |
| Cash & Cash Equivalents and Net Assets | 12.45% |
| Treasury Bills | 11.11% |
The portfolio consists of 12 securities, with the ten largest holdings accounting for 87.43% of the fund. The largest holding is 6.94% CGL 2036 at 44.20%. Government Securities make up 76.45% of the total assets.
Objective
The scheme states its objective as follows.
To provide returns to the investors generated through investments in Government securities issued by the Central Government and/or State Government(s).
Fund managers
| Name | Role | Experience |
|---|---|---|
| Sudhir Agarwal | 12 Years |
SBI Gilt Fund: FAQs
What would ₹10,000 in the SBI Gilt Fund be worth today?
₹10,000 put into the Direct Growth plan on 3 November 2023 would have been worth ₹12,123 on 3 November 2026. This is what happened over those three years, not a forecast.
What is the return of the SBI Gilt Fund?
The Direct Growth plan returned 3.93% over one year to 3 November 2026, higher than the category average of 2.80%. Over three years it returned 6.62% a year.
What is the expense ratio of the SBI Gilt Fund?
The expense ratio of the Direct plan is 0.50%; the average for 26 Direct plans in the category is 0.50%.
How large is the SBI Gilt Fund?
Its assets were ₹8,067 crore at 30 September 2026.
What are the top holdings of the SBI Gilt Fund?
At 30 September 2026 the largest holdings were 6.94% CGL 2036 (44.20%), 7.71% CGL 2066 (21.50%), 7.28% State Government of Andhra Pradesh 2032 (6.61%). The top ten made up 87.43% of the fund.
Who manages the SBI Gilt Fund?
The fund is managed by Sudhir Agarwal.
What is the minimum investment in the SBI Gilt Fund?
The minimum investment is ₹5,000. The minimum is ₹500.
What is the exit load of the SBI Gilt Fund?
The scheme states its exit load as: Nil
What is the benchmark of the SBI Gilt Fund?
The scheme’s benchmark is the Nifty All Duration G-Sec Index.
NAV, expense and portfolio data: Accord Fintech. Calculations: ThePip. For information only; not investment advice.