Nippon India Large Cap Fund: Down 6.16% in a Year, but ₹10,000 Put In Three Years Ago Is ₹13,858 Now


Key Highlights
₹10,000 in Nippon India Large Cap Fund three years ago is ₹13,858 now (3 Nov 2026). 1-year −6.16%, 3-year 11.48% a year.
Returns as of: 3 November 2026
- ₹10,000 put in three years ago is worth ₹13,858 now
- 1-year return: −6.16%, lower than the category average of −3.58%
- 3-year return: 11.48% a year, higher than the category average of 11.01%
- Expense ratio (Direct plan): 0.88%, lower than the category average of 1.15%
- Assets: ₹51,296 crore at 30 September 2026
- Largest holding: HDFC Bank Limited, 9.61% of the fund; the top ten are 43.65%
- Volatility over three years: 13.66% a year
Nippon India Large Cap Fund returned −6.16% over the past year. A ₹10,000 investment in this Equity – Large Cap Fund three years ago is worth ₹13,858 now. The expense ratio is 0.88%. Total assets were ₹51,296 crore at 30 September 2026.
Nippon India Large Cap Fund: key details
| Fund house | Nippon India Mutual Fund |
| Category | Equity – Large Cap Fund |
| 100 – TRI | |
| Expense ratio (Direct plan) | 0.88% |
| Assets | ₹51,296 crore (30 September 2026) |
| Minimum investment | ₹100 |
| ₹100 | |
| Exit load | 1% on or before 7D, Nil after 7D |
| Fund managers | Sailesh Raj Bhan, Bhavik Dave |
Nippon India Large Cap Fund: returns
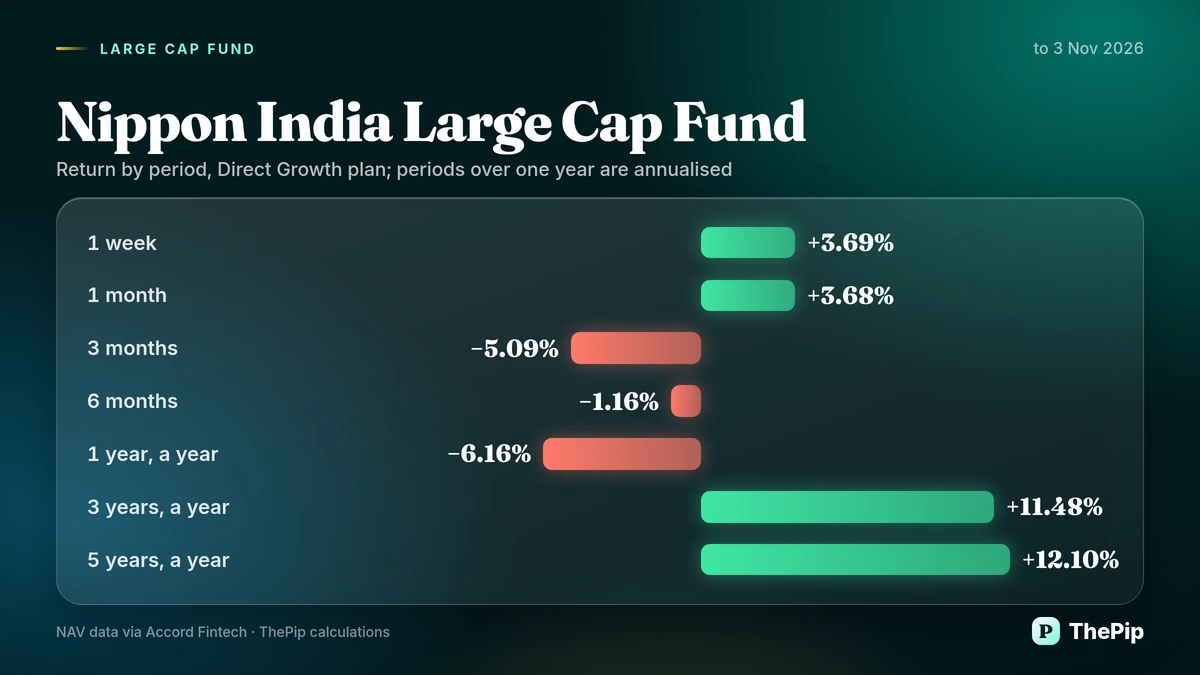
| Period | Fund return | Category average | Rank in category |
|---|---|---|---|
| 1 week | 3.69% | – | – |
| 1 month | 3.68% | – | – |
| 3 months | −5.09% | – | – |
| 6 months | −1.16% | – | – |
| 1 year (a year) | −6.16% | −3.58% (33 funds) | 30 of 33 |
| 3 years (a year) | 11.48% | 11.01% (30 funds) | 9 of 30 |
| 5 years (a year) | 12.10% | – | – |
The 1-year return of −6.16% is lower than the category average of −3.58%. Over three years, the fund returned 11.48% a year, which is higher than the category average of 11.01%.
Assets over recent months
| Month | Assets (₹ crore) |
|---|---|
| 30 April 2026 | 51,690 |
| 31 May 2026 | 51,660 |
| 30 June 2026 | 53,227 |
| 31 July 2026 | 54,225 |
| 31 August 2026 | 54,134 |
| 30 September 2026 | 51,296 |
Volatility and largest fall
| Measure | Fund | Category median |
|---|---|---|
| Volatility (annualised) | 13.66% | 13.40% |
| Largest fall from a high (27 September 2024 to 28 February 2025) | −15.37% | −16.52% |
The fund recorded a volatility of 13.66% a year, which is higher than the category median of 13.40%. Its largest fall from a high was −15.37%, which is smaller than the category median of −16.52%.
Portfolio: top holdings
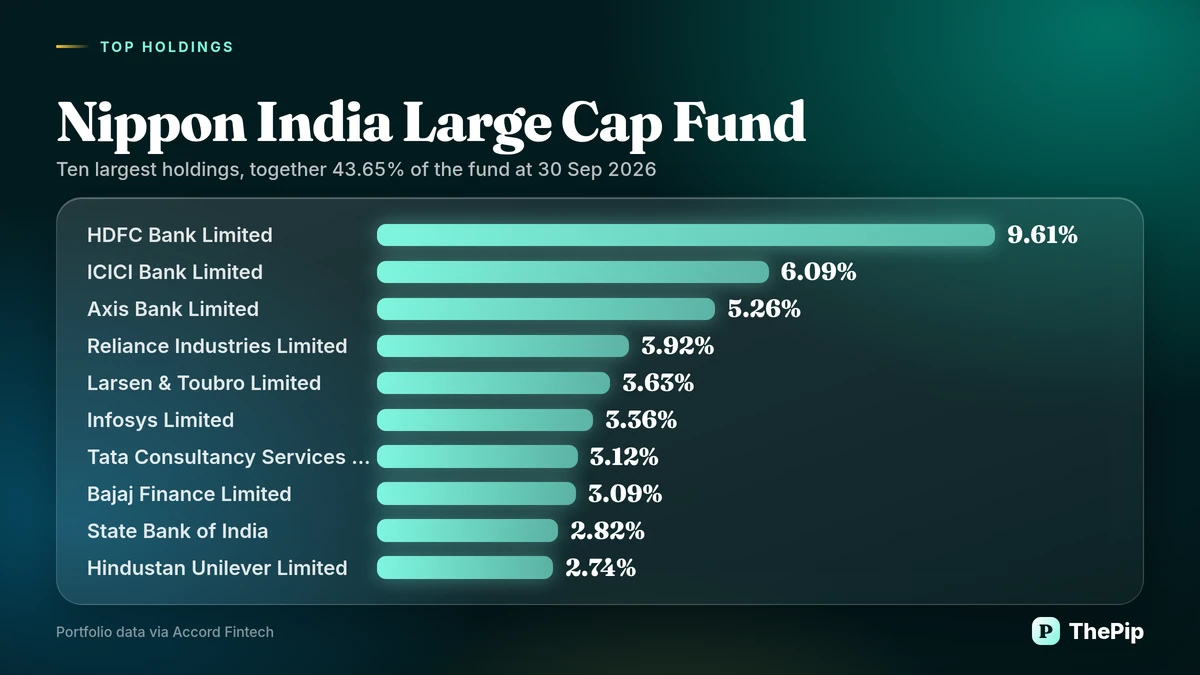
| Holding | Sector | Value (₹ crore) | |
|---|---|---|---|
| HDFC Bank Limited | Banks | 9.61% | 4,931 |
| ICICI Bank Limited | Banks | 6.09% | 3,125 |
| Axis Bank Limited | Banks | 5.26% | 2,699 |
| Reliance Industries Limited | Petroleum Products | 3.92% | 2,011 |
| Larsen & Toubro Limited | Construction | 3.63% | 1,860 |
| Infosys Limited | IT – Software | 3.36% | 1,725 |
| Tata Consultancy Services Limited | IT – Software | 3.12% | 1,599 |
| Bajaj Finance Limited | Finance | 3.09% | 1,586 |
| State Bank of India | Banks | 2.82% | 1,447 |
| Hindustan Unilever Limited | Diversified FMCG | 2.74% | 1,407 |
| Sector | Weight |
|---|---|
| Banks | 26.12% |
| Retailing | 8.34% |
| IT – Software | 8.27% |
| Pharmaceuticals & Biotechnology | 7.49% |
| Diversified FMCG | 5.31% |
| Finance | 4.48% |
| Type | Weight |
|---|---|
| Domestic Equities | 99.70% |
| Cash & Cash Equivalents and Net Assets | 0.30% |
| Change | Holding | Weight |
|---|---|---|
| Added | Bharti Airtel Limited | 0.51% |
| Added | Dabur India Limited | 0.37% |
| Added | Of India Ltd | 0.34% |
| Weight rose | HDFC Bank Limited | 8.65% to 9.61% |
| Weight fell | ICICI Bank Limited | 6.71% to 6.09% |
| Weight fell | Fintech Limited | 0.92% to 0.47% |
| Weight rose | ITC Limited | 2.13% to 2.56% |
| Weight fell | Mahindra & Mahindra Limited | 2.92% to 2.49% |
The ten largest holdings account for 43.65% of the portfolio. HDFC Bank Limited is the largest holding at 9.61%. Since the previous month, the weight of HDFC Bank Limited rose to 9.61% from 8.65%, while the weight of ICICI Bank Limited fell to 6.09% from 6.71%.
Objective
The scheme states its objective as follows.
The primary investment objective of the scheme is to seek to generate long term capital appreciation by investing predominantly into equity and equity related instruments of large cap companies. The secondary objective is to generate consistent returns by investing in debt, money market securities, REITs and InvITs.
Fund managers
| Name | Role | Experience |
|---|---|---|
| Sailesh Raj Bhan | Senior – Equity | 10 Years |
| Bhavik Dave | Co- Fund Manager & Research Analyst | 5 Years |
Nippon India Large Cap Fund: FAQs
What would ₹10,000 in the Nippon India Large Cap Fund be worth today?
₹10,000 put into the Direct Growth plan on 3 November 2023 would have been worth ₹13,858 on 3 November 2026. This is what happened over those three years, not a forecast.
What is the return of the Nippon India Large Cap Fund?
The Direct Growth plan returned −6.16% over one year to 3 November 2026, lower than the category average of −3.58%. Over three years it returned 11.48% a year.
What is the expense ratio of the Nippon India Large Cap Fund?
The expense ratio of the Direct plan is 0.88%; the average for 35 Direct plans in the category is 1.15%.
How large is the Nippon India Large Cap Fund?
Its assets were ₹51,296 crore at 30 September 2026.
What are the top holdings of the Nippon India Large Cap Fund?
At 30 September 2026 the largest holdings were HDFC Bank Limited (9.61%), ICICI Bank Limited (6.09%), Axis Bank Limited (5.26%). The top ten made up 43.65% of the fund.
Who manages the Nippon India Large Cap Fund?
The fund is managed by Sailesh Raj Bhan, Bhavik Dave.
What is the minimum investment in the Nippon India Large Cap Fund?
The minimum investment is ₹100. The minimum is ₹100.
What is the exit load of the Nippon India Large Cap Fund?
The scheme states its exit load as: 1% on or before 7D, Nil after 7D
What is the benchmark of the Nippon India Large Cap Fund?
The scheme’s benchmark is the BSE 100 – TRI.
NAV, expense and portfolio data: Accord Fintech. Calculations: ThePip. For information only; not investment advice.