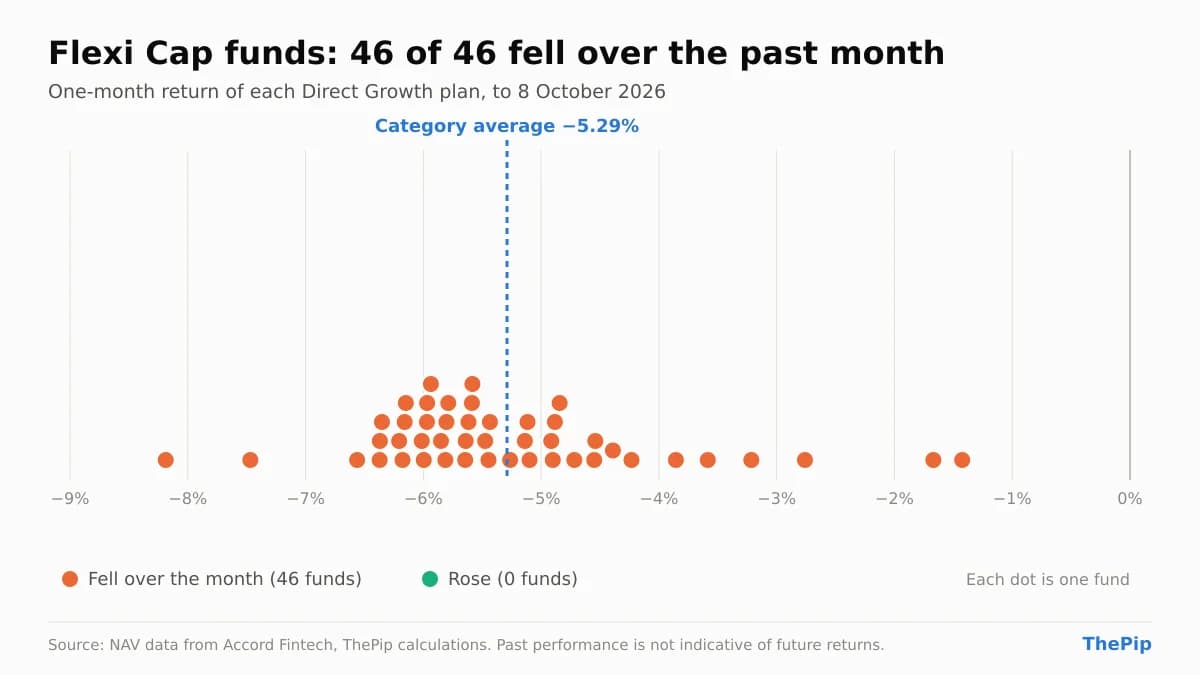
Flexi Cap funds: average 1-month −5.29%, 1-year −1.31%, 3-year 10.94% a year across 47 Direct Growth plans, to 8 October 2026.
Returns as of: 8 October 2026
- Category average return: 1 month −5.29%, 1 year −1.31%, 3 years 10.94% a year
- Funds that fell over the past month: 46 of 46
- Funds with a positive 1-year return: 14 of 41
- Share of 1-year rolling windows below zero: 8%
- Average expense ratio of Direct plans: 1.09%
- Largest fund by assets: Parag Parikh Flexi Cap Fund
Flexi Cap funds performance across 47 Direct Growth plans resulted in a one-month average return of −5.29% to 8 October 2026. During this period, 46 of 46 funds fell and 0 rose. Over the one-year period, the average return was −1.31%, with 14 of 41 funds recording a positive return.
Flexi Cap funds: returns across the category
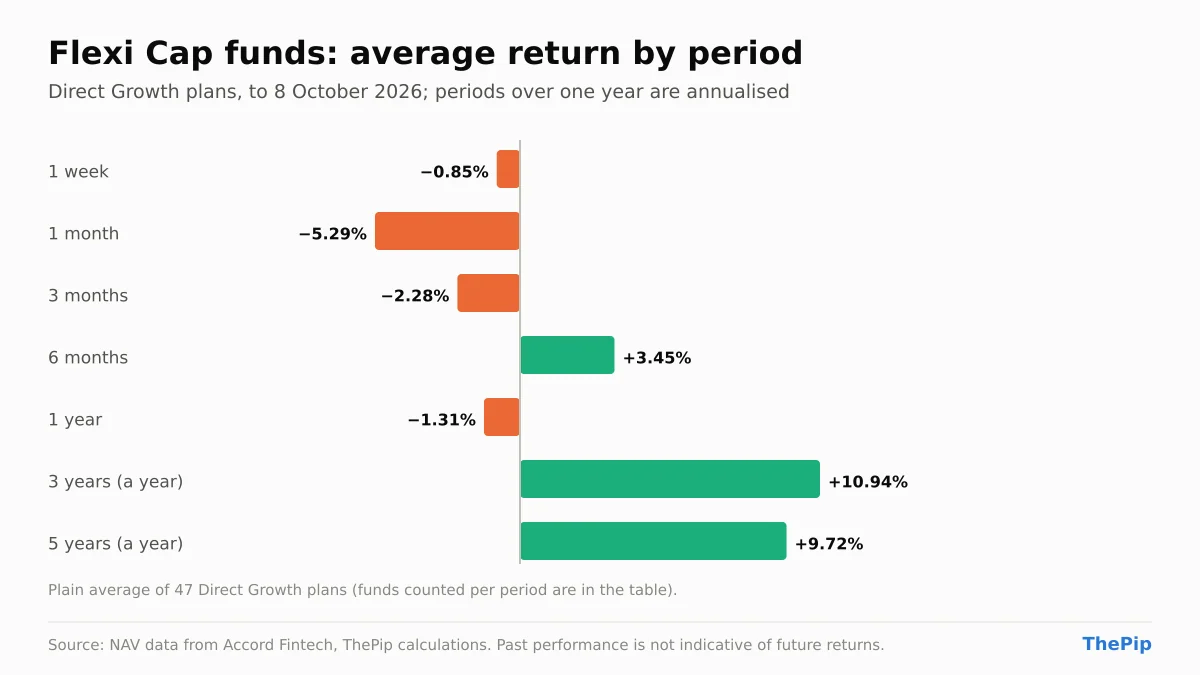
| Period | Average | Median | Funds with a positive return | Funds counted |
|---|---|---|---|---|
| 1 week | −0.85% | −0.91% | 4 of 47 | 47 |
| 1 month | −5.29% | −5.59% | 0 of 46 | 46 |
| 3 months | −2.28% | −2.93% | 9 of 45 | 45 |
| 6 months | 3.45% | 3.80% | 32 of 45 | 45 |
| 1 year | −1.31% | −1.79% | 14 of 41 | 41 |
| 3 years (a year) | 10.94% | 10.75% | 36 of 37 | 37 |
| 5 years (a year) | 9.72% | 9.37% | 27 of 27 | 27 |
The 1-year average return of −1.31% is lower than the 3-year average return of 10.94%. While the 1-year average was negative, the 3-year average was positive. Across the category, 36 of 37 funds delivered a positive return over the 3-year period.
Highest and lowest returns over the past month
| Fund | 1 month | 1 week |
|---|---|---|
| Taurus Flexi Cap Fund | −1.42% | −0.86% |
| Parag Parikh Flexi Cap Fund | −1.67% | 0.00% |
| 360 ONE Flexicap Fund | −2.76% | 0.22% |
| Fund | 1 month | 1 week |
|---|---|---|
| LIC MF Flexi Cap Fund | −8.19% | −1.54% |
| The Wealth Company Flexi Cap Fund | −7.47% | −1.67% |
| Edelweiss Flexi Cap Fund | −6.56% | −0.86% |
Highest 3-year returns
| Fund | 1 year | 3 years (a year) | Expense ratio |
|---|---|---|---|
| Bank of India Flexi Cap Fund | 7.75% | 17.78% | 0.85% |
| ITI Flexi Cap Fund | 9.51% | 17.59% | 0.91% |
| Motilal Oswal Flexi Cap Fund | −0.64% | 16.91% | 1.22% |
| 360 ONE Flexicap Fund | 7.07% | 16.38% | 0.92% |
| Invesco India Flexi Cap Fund | −2.67% | 15.59% | 0.86% |
Rolling returns
| Measure | Category average 1-year return |
|---|---|
| Lowest window | −5.3% (ending 26 September 2025) |
| Median | 13.1% |
| Highest window | 44.9% (ending 28 March 2024) |
| Share of windows below zero | 8% |
| Latest window (ending 8 October 2026) | −2.1% |
The rolling 1-year returns for 32 funds showed a lowest window of −5.3%, a median of 13.1%, and a highest of 44.9%. The latest rolling window of −2.1% is lower than the median rolling window of 13.1%.
Largest funds and costs
| Fund | Assets (₹ crore) | 1 year | 3 years (a year) |
|---|---|---|---|
| Parag Parikh Flexi Cap Fund | 1,47,405 | −4.68% | 12.27% |
| HDFC Flexi Cap Fund | 1,13,606 | −4.25% | 13.97% |
| Kotak Flexi Cap Fund | 56,392 | −6.05% | 9.55% |
| Aditya Birla SL Flexi Cap Fund | 29,044 | 3.49% | 13.33% |
| ICICI Pru Flexi Cap Fund | 25,895 | 0.24% | 14.39% |
| Expense ratio | Funds counted | |
|---|---|---|
| Average | 1.09% | 46 |
| Lowest: Abakkus Flexi Cap Fund | 0.40% | |
| Highest: Taurus Flexi Cap Fund | 2.69% |
Parag Parikh Flexi Cap Fund is the largest fund with assets of ₹1,47,405 crore. The average expense ratio across 46 Direct plans is 1.09%. The expense ratio ranges from a low of 0.40% to a high of 2.69%.
Flexi Cap funds: FAQs
How have Flexi Cap funds performed over the past year?
The average 1-year return of 41 Direct Growth Flexi Cap funds was −1.31% to 8 October 2026, and 14 of them had a positive return. The average 3-year return was 10.94% a year across 37 funds.
What is the average expense ratio of Flexi Cap funds?
The average expense ratio of 46 Direct plans in the Flexi Cap category is 1.09%. It ranges from 0.40% (Abakkus Flexi Cap Fund) to 2.69% (Taurus Flexi Cap Fund).
Which Flexi Cap fund is the largest?
Parag Parikh Flexi Cap Fund has the largest assets among Flexi Cap funds, ₹1,47,405 crore at 31 August 2026, across all its plans.
What are rolling returns?
Rolling returns measure the return over every window of a fixed length, not just the one ending today. Here, each 1-year window ending between 9 October 2023 and 8 October 2026 is averaged across 32 funds, so the result does not depend on one start date.
Why are Direct plans compared?
Direct plans have no distributor commission in their cost, so they are the cleanest way to compare the funds themselves. Regular plans of the same funds charge a higher expense ratio, which reduces their returns.
This article is for information only and is not investment advice. Returns are for Direct Growth plans to 8 October 2026; periods over one year are annualised. Averages are plain averages of the funds that have the figure, and each table says how many that is. NAV, expense and portfolio data are from Accord Fintech; calculations are by ThePip. Past performance is not indicative of future returns. Mutual fund investments are subject to market risks; read all scheme-related documents carefully.