FII DII data shows FIIs sold ₹8,991 crore and DIIs bought


Key Highlights
FII DII data for the week shows FIIs sold a net ₹8,991 crore. DIIs bought a net ₹15,135 crore during the same 5 sessions.
Updated: Saturday 17 October 2026
- FIIs sold a net ₹8,991 crore and DIIs bought a net ₹15,135 crore over the week.
- FIIs were net sellers on 4 of 5 sessions; DIIs were net buyers on 5 of 5.
- The largest sale was ₹5,285 crore on Thu 15 Oct; the largest purchase was ₹3,661 crore on Fri 16 Oct.
- FIIs have been net sellers in each of the last 6 weeks, ₹95,156 crore in all.
- 22 of 29 sectors show a lower average foreign holding in 2026-06 than in 2026-03.
The latest FII DII data shows that FIIs sold a net ₹8,991 crore over 5 sessions, while DIIs bought a net ₹15,135 crore. FIIs have been net sellers in each of the last 6 weeks, with a total sale of ₹95,156 crore.
Day by day
FIIs were net sellers on 4 of 5 sessions, while DIIs were net buyers on 5 of 5 sessions. The largest FII sale was ₹5,285 crore on Thursday 15 Oct. The largest DII purchase was ₹3,661 crore on Friday 16 Oct.
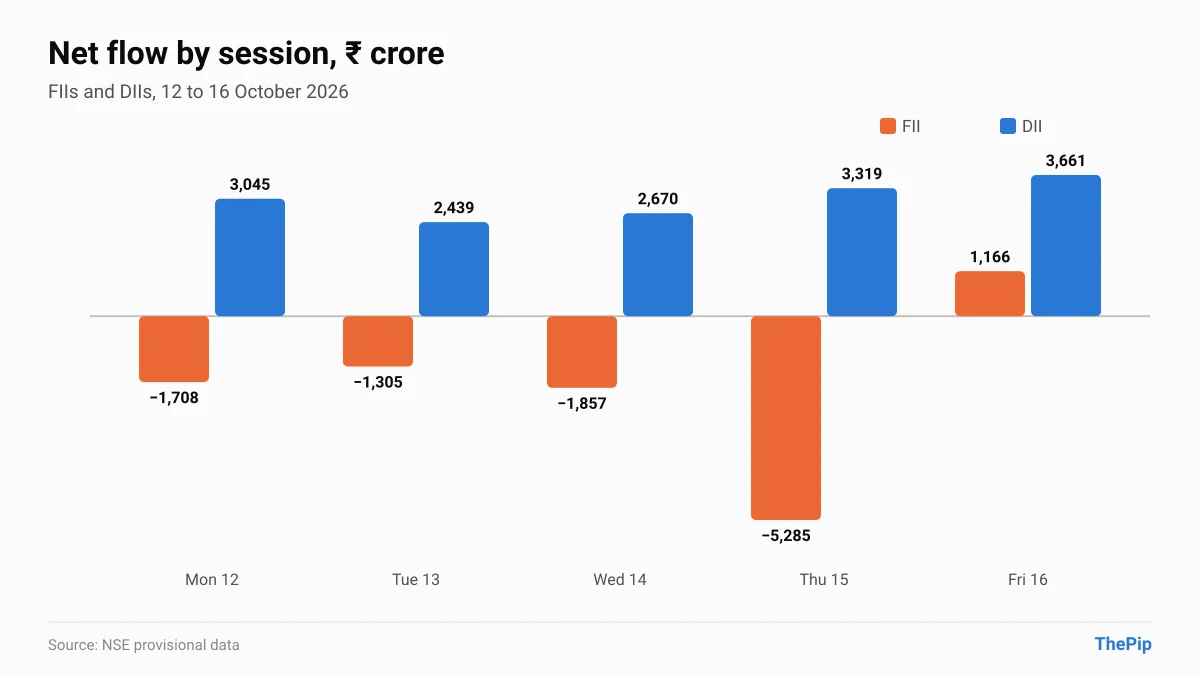
| Day | FII net | DII net |
|---|---|---|
| Mon 12 Oct | −1,708 | +3,045 |
| Tue 13 Oct | −1,305 | +2,439 |
| Wed 14 Oct | −1,857 | +2,670 |
| Thu 15 Oct | −5,285 | +3,319 |
| Fri 16 Oct | +1,166 | +3,661 |
| Week | −8,990 | +15,135 |
| Buy | Sell | Net | |
|---|---|---|---|
| FII | 75,118 | 84,108 | −8,990 |
| DII | 85,809 | 77,996 | +15,135 |
The last six weeks
FIIs have been net sellers in each of the last 6 weeks. Over this period, FIIs sold a net ₹95,156 crore. DIIs bought a net ₹1,12,953 crore over the same 6 weeks.
| Week starting | Sessions | FII net | DII net |
|---|---|---|---|
| 7 Sep | 5 | −1,795 | +6,419 |
| 14 Sep | 4 | −7,620 | +11,232 |
| 21 Sep | 5 | −11,490 | +16,398 |
| 28 Sep | 4 | −34,966 | +33,455 |
| 5 Oct | 5 | −30,294 | +30,313 |
| 12 Oct | 5 | −8,990 | +15,135 |
| 6 weeks | 28 | −95,156 | +1,12,953 |
Foreign portfolio investors: equity and debt
Foreign portfolio investors sold a net ₹7,935 crore of equity and sold a net ₹1,579 crore of debt. The rupee averaged 95.54 to the dollar during the week. These depository figures differ from the NSE exchange total of ₹8,991 crore.
| Week starting | Equity net | Debt net | Average ₹ per US$ |
|---|---|---|---|
| 5 Oct | −34,934 | +2,773 | 96.42 |
| 12 Oct | −7,935 | −1,579 | 95.54 |
Foreign holding by sector
Quarterly data for 2191 companies shows 22 of 29 sectors with a lower average foreign holding and 7 with a higher one. The Bank – Private sector saw the largest fall of 0.81 points. This quarterly data covers 29 sectors.
| Sector | Companies | March 2026 | June 2026 | Change (points) |
|---|---|---|---|---|
| Bank – Private | 29 | 19.09% | 18.28% | −0.81 |
| Plastic Products | 41 | 5.48% | 4.82% | −0.66 |
| Hospital & Healthcare Services | 32 | 11.48% | 10.93% | −0.55 |
| Consumer Food | 42 | 5.50% | 5.06% | −0.43 |
| Retailing | 34 | 6.59% | 6.17% | −0.42 |
| Aerospace & Defense | 22 | 4.13% | 5.03% | +0.90 |
| Electric Equipment | 51 | 5.90% | 6.06% | +0.16 |
Daily flow data has no split by sector. This table is quarterly shareholding from company filings: it describes the quarters named, not the period above, and is an average of holding percentages, not money invested.
FII DII data: FAQs
How much did FIIs sell this week?
FIIs sold a net ₹8,991 crore over 5 sessions, and DIIs bought a net ₹15,135 crore, on NSE provisional data.
For how long have FIIs been selling?
FIIs have been net sellers in each of the last 6 weeks, ₹95,156 crore in all, while DIIs bought a net ₹1,12,953 crore over the same weeks.
What does FII net selling mean?
Foreign institutions sold more shares than they bought on the exchange; the net figure is their purchases minus their sales.
Why do the NSE and SEBI figures differ?
NSE publishes provisional exchange data every day; SEBI’s figures come from the depositories and cover foreign portfolio investors, so the two are never the same number.
Flows are NSE provisional data; foreign portfolio investor figures are SEBI depository data; holdings are from company shareholding filings. Calculations are by ThePip. For information only; not investment advice.