Net profit margin for Bharat Petroleum is 3.1% in Q2 FY27


Key Highlights
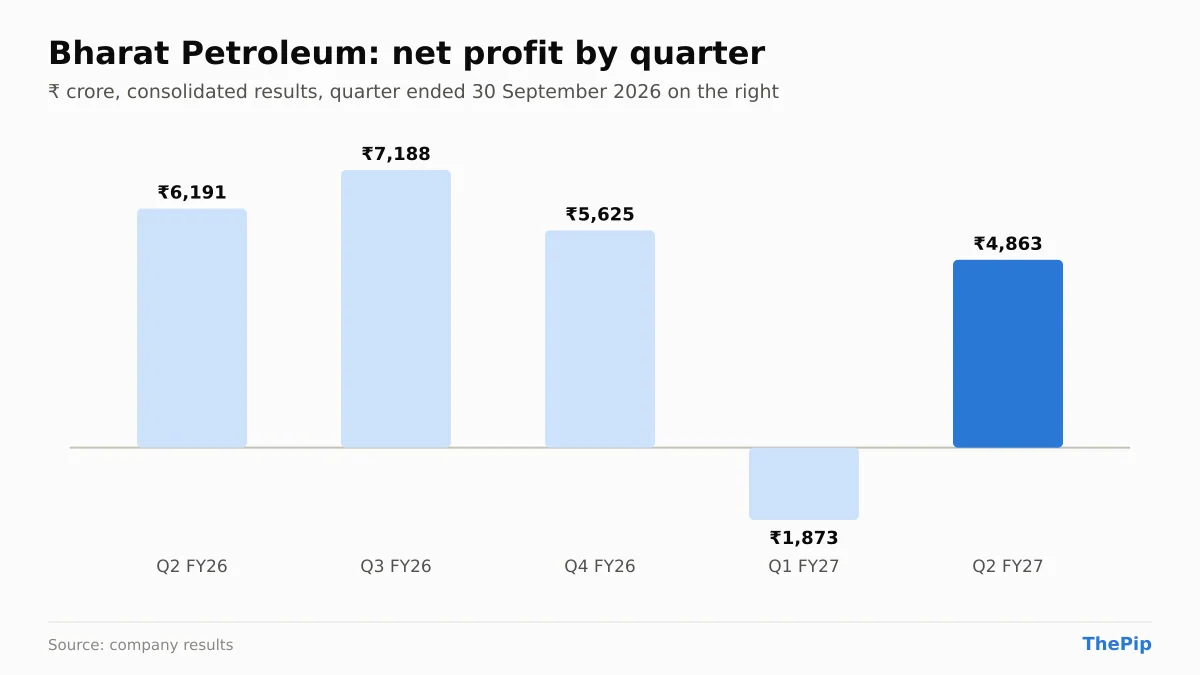
Bharat Petroleum Q2 FY27 results show a net profit of ₹4,863 crore. Revenue from operations for the quarter reached ₹1,57,818 crore.
Updated: Friday 23 October 2026
- Bharat Petroleum reported a net profit of ₹4,863 crore in Q2 FY27, 21.46% lower than a year earlier.
- from operations: ₹1,57,818 crore, 29.78% higher than a year earlier.
- Net profit margin: 3.08% (5.09% a year earlier).
- Shares: ₹281.95, −1.74% at 15:59 IST on 23 Oct 2026.
Bharat Petroleum Q2 FY27 results show a net profit of ₹4,863 crore. This figure is 21.46% lower than the same quarter a year earlier.
The company reported revenue from operations of ₹1,57,818 crore. These results were filed on Friday 23 October 2026 at 7:16 pm IST.
Bharat Petroleum Q2 FY27 results at a glance
| ₹ crore | Q2 FY27 | Q2 FY26 | Change | Q1 FY27 | Change |
|---|---|---|---|---|---|
| Revenue from operations | 1,57,818 | 1,21,605 | +29.78% | 1,59,527 | −1.07% |
| 6,560 | 8,345 | −21.39% | −3,216 | – | |
| Net profit | 4,863 | 6,191 | −21.46% | −1,873 | – |
| Earnings per share | ₹11.38 | ₹14.49 | −21.46% | −₹4.38 | – |
| Net profit as a share of revenue | 3.08% | 5.09% | – | −1.17% | – |
The company reported a profit before tax of ₹6,560 crore for the quarter. Net profit was 21.46% lower than the ₹6,191 crore recorded in Q2 FY26. The net profit margin stood at 3.08% compared to 5.09% in the same quarter last year and −1.17% in Q1 FY27. For the half-year to 30 September 2026, the company recorded a net profit of ₹2,990 crore.
Bharat Petroleum half-year figures
| ₹ crore | Half-year | Same period a year earlier | Change |
|---|---|---|---|
| Revenue from operations | 3,17,345 | 2,51,219 | +26.32% |
| Net profit | 2,990 | 13,031 | −77.05% |
Bharat Petroleum share price after the results
| Share price (15:59 IST) | ₹281.95 |
| Previous close | ₹286.95 |
| Change | −₹5.00 (−1.74%) |
| Nifty Energy | −1.66% |
| −0.39% |
The BPCL share price closed at ₹281.95 on 23 October 2026. This represents a 1.74% decline from the previous close of ₹286.95. The results were filed at 7:16 pm IST, after the trading session closed.
How Bharat Petroleum shares moved on its earlier results
| Quarter | Results filed | Window | Change |
|---|---|---|---|
| Q1 FY27 | 22 Jul 2026 | 21 Jul 2026 to 22 Jul 2026 | −1.68% |
| Q4 FY26 | 19 May 2026 | 19 May 2026 to 20 May 2026 | +2.55% |
The company shares moved by −1.68% between the last close before the Q1 FY27 filing and the next close. On the release of the Q4 FY26 results, the share price moved by +2.55% between the last close before the filing and the next close.
Bharat Petroleum Q2 FY27 results: FAQs
What were Bharat Petroleum’s Q2 FY27 results?
Bharat Petroleum reported a net profit of ₹4,863 crore and revenue from operations of ₹1,57,818 crore for the quarter ended 30 September 2026 (consolidated figures). Net profit was 21.46% lower than a year earlier and revenue from operations was 29.78% higher than a year earlier.
When did Bharat Petroleum announce its Q2 FY27 results?
The results were filed with the exchange at Fri 23 Oct, 7:16 pm IST.
What was Bharat Petroleum’s net profit margin in Q2 FY27?
Net profit was 3.08% of revenue, against 5.09% in the same quarter a year earlier.
What is the Bharat Petroleum share price after the results?
₹281.95, −1.74% from the previous close of ₹286.95, at 15:59 IST on Friday 23 October 2026. The results were filed at 19:16 IST, after the session closed; this move came before they were published.
Results are the company’s filings to the exchanges; prices are from the National Stock Exchange. Calculations are by ThePip. For information only; not investment advice.